The Rise of Sinophobia on Twitter during the Covid-19 Pandemic — Technical Part 2
Written by Philipp Wicke and Marta Ziosi for AI For People — 06.06.2020
In the last part of our technical analysis, we have explained how you can create your own corpus of tweets about a certain topic. In this part, we want to investigate some research hypothesis and test them on our corpus. Most of this code will be easy to understand and simple to implement.
The focus of this article is to intersect between the rapid news development, fake news, trustworthy journalism and conspiracies — and deliver a reproducible and beginner friendly introduction for those who want to have a look at the data themselves. Not so much in order to compete with proper journalism, but in order to shed some light on how trends can be observed and how science, media and journalism can approach these problems using computational tools.
Creating a Corpus
From the 20.03.2020 until the 11.05.2020 we collected about 25,000 tweets every day (except for 10.04, 15.04 and 16.04 — due to some access issues on Twitter) with the keywords related to the Covid-19 epidemic (as described in the last post). Now, we need to come up with some processing steps to create the corpus we want to investigate.
Notably, there are some other researchers that provide corpora of tweets related to the Covid-19 pandemic. For example Coronavirus Twitter Data and Coronavirus Tweets Dataset. Due to Twitter’s privacy policy it is not allowed to publish collected tweets as datasets?
Therefore, all of the available “datasets” that are linked here and most of those that you can find, will only store the Tweet-ID for the certain corpus to be created. Consequently, you’ll have to download all tweets yourself again. You can achieve this with the free software tool Hydrator. It takes your list of Tweet-IDs and automatically downloads all tweets.
Now, you have either created a collection of tweets yourself or you have used an available database of Tweet-IDs to create your collection of tweets. There is one more consideration before we are going to investigate a corpus. On Twitter a lot of content is created by a small group of users. Therefore, we have filtered out multiple tweets from the same users (as explained in the previous episode of this article). Ideally, the resulting corpus should be stored as text file with one tweet per line, including the date. In this tutorial, we will use the following format: YYYY-MM-DD ::: TWEET (Year, month and day ::: one tweet per line).
Research Questions
There are a lot of factors and features that we can investigate within a corpus. Let us address the following research questions with a more refined analysis:
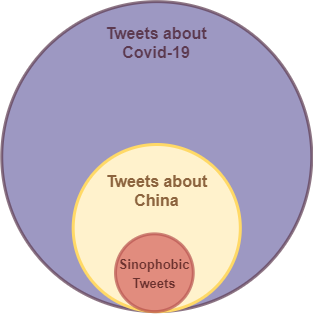
- Research Question 01: How many Covid-19 tweets are about “China” (i.e. #China, #Chinese)?
- Research Question 02: Among those “China”-tweets, how many feature sinophobic keywords (i.e. #Chinavirus, chink, etc)?
- Research Question 03: Given Research Question 02, what percentage is this of the total number of tweets collected generally about the pandemic? And of the ones about the pandemic and china?
- Research Question 04: Does this percentage change over time?
All of these research questions do not try to prove statistical significance. We are performing this analysis on a very small corpus in order to show an example of how such an analysis can be conducted with little effort and little data.
In order to create our subcorpus, which features only those tweets that are about China, we have to apply a filter:
# opening a new subcorpus file to write (w) in
with open("china_subcorpus.txt", "w") as f_out:
    with open("covid19_corpus.txt", "r") as f_in:
        lines = f_in.readlines()

        for line in lines:
            if "china" in line.lower() or "chinese" in line.lower():
                f_out.write(line)
Here, we have simply read our corpus line by line and if the line contains the word “china” or “chinese”, we write the line into a new file. Note that we have used “line.lower()” to match China = china and Chinese = chinese in case these words were spelled differently in the tweets.
Research Question 01
Now, we can calculate the proportion of tweets that include China/Chinese from the total corpus. We know that in our example, the corpus held 638,358 tweets about Covid-19 — in code, you could query “len(lines)” from the code above to inspect the length of the corpus. Therefore, we can proceed with:
chinese_corpus= len(all_tweets)
print(“Percentage of Chinese tweets from entire corpus: %.2f%%” % ((chinese_corpus/ENTIRE_CORPUS)*100))
This will evaluate to: Percentage of Chinese tweets from entire corpus: 2.63%. And consequently we can answer our research question. We can always extend this question at this point and compare this number to “German” or “English” occurrences. But let us move on to the next research question.
Research Question 02
We now want to identify how many of those “Chinese”-tweets are sinophobic. We could also extend this to the entire corpus, but for now we want to proceed with a sub-corpus analysis. First of all, we need to come up with a list of sinophobic expressions. For this, we had a look at the of English derogatory terms on the Wikipedia entry “Anti-Chinese sentiment”. We’ve also included expressions from the paper “Go eat a bat, Chang!: An Early Look on the Emergence of Sinophobic Behavior on Web Communities in the Face of COVID-19" by Schild, L., Ling, C., Blackburn, J., Stringhini, G., Zhang, Y., & Zannettou, S. (2020). We can now define our list of sinophobic words as follows:
# define the keywords
sinophobic_keywords = set(["kungfuvirus", "chinesevirus", "chinavirus", "chinesewuhanvirus", "wuhanvirus", "chink", "bugland", "chankoro", "chinazi", "gook", "insectoid", "bugmen", "chingchong"])
Additionally, we could also include sinophobic compound expressions. For example, we could define a list of negative words e.g. “stupid”, “weak”, “f#cking”, “damn”, “ugly” and check if these words appear before “China” or “Chinese”.
Now, we can run this set of keywords against our sub-corpus and count the occurrences of each keyword. As we want to know which sinophobic word occurs a lot and which does not, we store all sinophobic keywords in a dictionary and initialize their count at 0:
# make a dictionary out of the keywords with the value
# being the count for its occurrence
sinophobic_occurrences = dict()
for keyword in sinophobic_keywords:
    # initialize them all with counter being 0
    sinophobic_occurrences[keyword.lower()] = 0

# all_tweets[timestamp]:tweet with tweets
# being the value, therefore iterate over the values()
for tweet in all_tweets.values():
    # accessing the tweet (the text is stored in tweet[1])
    tweet = tweet[1]
    # for every sinophobic keyword in our set
    for sino_word in sinophobic_keywords:
        # check if the sinophobic keyword can be found in the tweet
        if sino_word in tweet.lower():
            # here we know which tweet has
            # what kind of sinophobic word
            sinophobic_occurrences[sino_word.lower()] += 1

print(sinophobic_occurrences)
This code will provide us with the result: {‘kungfuvirus’: 2, ‘bugmen’: 0, ‘chingchong’: 1, ‘chinazi’: 30, ‘bugland’: 0, ‘chinesevirus’: 1305, ‘chinavirus’: 980, ‘chankoro’: 0, ‘gook’: 0, ‘insectoid’: 0, ‘chinesewuhanvirus’: 153, ‘chink’: 4, ‘wuhanvirus’: 698}. In order to answer the research question, we need to count the individual tweets that have at least one sinophobic word, as opposed to our previous count that can include multiple sinophobic terms in a single tweet. We could adapt the code above to do that or we can just iterate over the corpus:
single_sinophobic_occurrences = 0
for tweet in all_tweets.values():
    # accessing the tweet (the timestamp is stored in tweet[0])
    tweet = tweet[1]
    # for every sinophobic keyword in our set
    for sino_word in sinophobic_keywords:
        # check if the sinophobic keyword can be found in the tweet
        if sino_word in tweet.lower():
            single_sinophobic_occurrences += 1
            break
print("Number of sino. tweets: "+str(single_sinophobic_occurrences))This results in: Number of sino. tweets: 2531 and we can head to our third research question.
Research Question 03
We can now answer the third research question by putting all of our numbers in place and evaluate the percentages:
total_num_covid_tweets = ENTIRE_CORPUS
total_num_covid_chinese_tweets = len(all_tweets)
total_num_sinophobic_tweets = single_sinophobic_occurrences
print("Percentage of Sinophobic tweets from Chinese sub-corpus: %.2f%%" % ((total_num_sinophobic_tweets/total_num_covid_chinese_tweets)*100))
print("Percentage of Sinophobic tweets from entire corpus: %.2f%%" % ((total_num_sinophobic_tweets/total_num_covid_tweets)*100))
The result here is: Percentage of Sinophobic tweets from Chinese sub-corpus: 15.02%, Percentage of Sinophobic tweets from entire corpus: 0.39%. Note that the sinophobic tweets are only counted in the Chinese-subcorpus. There might as well be sinophobic tweets in the Covid-19 corpus that do not contain “China” or “Chinese”. This could be investigated further. Overall, it is an interesting result to observe more than 15% of all tweets that are about Covid-19 and China feature at least one sinophobic term.
Research Question 04
We can now perform a temporal analysis. Luckily, we have stored the time-stamps in our dictionary of tweets. We now need to parse this information and visualize it somehow. Here is a guideline of how we can proceed:
- Make a dictionary that stores all days from first to last day of the corpus, including any missing days.
- Go over the corpus again and look for sinophobic tweets, basically copy the code from above and paste it.
- This time, whenever you find a tweet containing a sinophobic tweet, increment the value for the respective day.
- Now, you’ll have a dictionary for every day with the number of counted sinophobic tweets on that day.
- Then divide each of those counted values by the total number of tweets of that day to receive the proportional value.
# import libraries to handle dates
from datetime import datetime, date, timedelta
# create dictionaries to store tweets
days_dict_sino = dict()
days_dict_all = dict()
# access the date entry (index 0) of the first tweet (index 0)
start_date_string = list(all_tweets.values())[0][0].split(" ")[0]
# access the date entry (index 0) of the last tweet (index -1)
end_date_string = list(all_tweets.values())[-1][0].split(" ")[0]
# format the date
start_date = datetime.strptime(start_date_string, '%Y-%m-%d')
end_date = datetime.strptime(end_date_string, '%Y-%m-%d')
delta = end_date - start_date
days = [start_date + timedelta(days=i) for i in range(delta.days + 1)]
# Create daily dictionaries
for day in days:
    day = day.strftime("%Y-%m-%d")
    days_dict_sino[day] = 0
    days_dict_all[day] = 0
# Fill daily dictionaries with counts of sinophobic tweets
for dat, tweet in all_tweets.values():
    day = dat.split(" ")[0]
    for sino_word in sinophobic_keywords:
        if sino_word in tweet.lower():
            days_dict_sino[day]+=1
    days_dict_all[day]+=1
After we have done that, we should have a list with absolute occurrences of sinophobic tweets in our China-Covid19-Corpus per day. Next we need to turn those numbers to proportional values:
all_daily_tweets = list(days_dict_all.values())
all_daily_sino_tweets = list(days_dict_sino.values())
perc_results = []
for tot_tweets, sino_tweets in zip(all_daily_tweets, all_daily_sino_tweets):
    if tot_tweets == 0:
        perc_results.append(0)
    else:
        perc_results.append((sino_tweets/tot_tweets)*100)
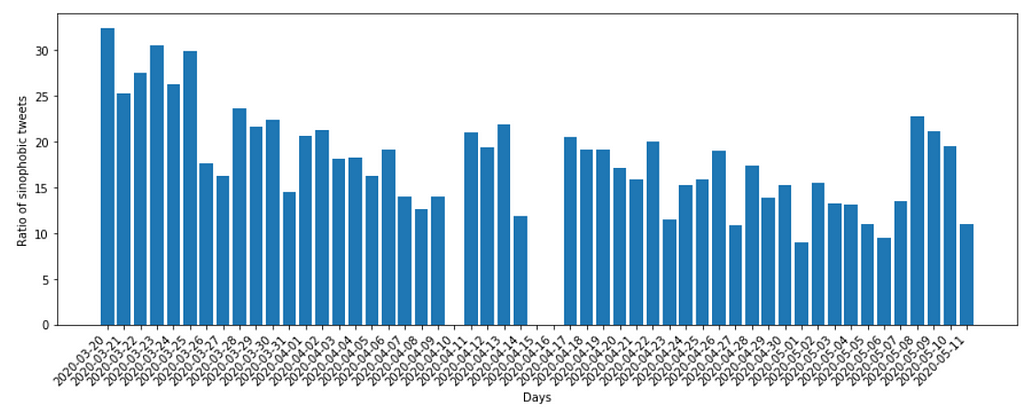
We can now simply use a plot function to visualize the trend over time. There are many ways of visualizing this kind of data, but we will look at a very basic bar graph using matplotlib:
import matplotlib.pyplot as plt
plt.figure(figsize=[15,5])
plt.xlabel("Days")
plt.ylabel("Ratio of sinophobic tweets")
plt.bar(range(0,len(perc_results)), perc_results)
plt.xticks(range(0,len(perc_results)), days_dict_all.keys(),  ha='right', rotation=45)
plt.show()
As a result we can observe the ratio of sinophobic tweets is relatively stable, except for a the last few days. Interpreting this graph and the data is the task of the next Conceptual article. Notably, we have included three days with missing data in the graph. Whenever you are collecting data on Twitter over the course of a few weeks, you can expect that there can be issues with the Twitter API. All other linked datasets also show missing data on other days.
We can now say that we have provided the empirical evaluation to discuss our research questions and the conceptual underpinnings. Our goal in this post was not to provide a strict, statistical analysis or hard empirical evidence — those can be found in numerous scientific articles (here, here, here and here).
In the next article, we can finally start to apply some Machine Learning. We will use topic modeling in order to see what other topics emerge in our corpus, i.e. what do people talk about when they talk about China and Covid-19. The next technical article will be accompanied by a conceptual article which will better explain the findings overall.
The Rise of Sinophobia on Twitter during the Covid-19 Pandemic — Technical Part 2 was originally published in AI for People on Medium, where people are continuing the conversation by highlighting and responding to this story.


