The Rise of Sinophobia on Twitter during the Covid-19 Pandemic — Technical Part 2

The Rise of Sinophobia on Twitter during the Covid-19 Pandemic — Technical Part 2

Written by Philipp Wicke and Marta Ziosi for AI For People — 06.06.2020

In the last part of our technical analysis, we have explained how you can create your own corpus of tweets about a certain topic. In this part, we want to investigate some research hypothesis and test them on our corpus. Most of this code will be easy to understand and simple to implement.

The focus of this article is to intersect between the rapid news development, fake news, trustworthy journalism and conspiracies — and deliver a reproducible and beginner friendly introduction for those who want to have a look at the data themselves. Not so much in order to compete with proper journalism, but in order to shed some light on how trends can be observed and how science, media and journalism can approach these problems using computational tools.

Creating a Corpus

From the 20.03.2020 until the 11.05.2020 we collected about 25,000 tweets every day (except for 10.04, 15.04 and 16.04 — due to some access issues on Twitter) with the keywords related to the Covid-19 epidemic (as described in the last post). Now, we need to come up with some processing steps to create the corpus we want to investigate.

Overview of the Corpus that will be created and analyzed.

Notably, there are some other researchers that provide corpora of tweets related to the Covid-19 pandemic. For example Coronavirus Twitter Data and Coronavirus Tweets Dataset. Due to Twitter’s privacy policy it is not allowed to publish collected tweets as datasets?

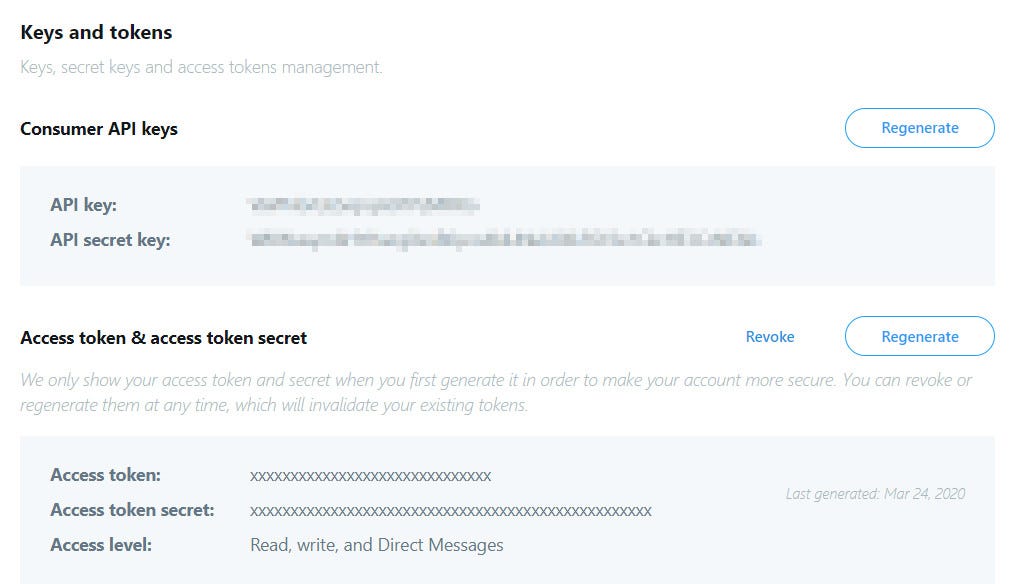
Therefore, all of the available “datasets” that are linked here and most of those that you can find, will only store the Tweet-ID for the certain corpus to be created. Consequently, you’ll have to download all tweets yourself again. You can achieve this with the free software tool Hydrator. It takes your list of Tweet-IDs and automatically downloads all tweets.

Now, you have either created a collection of tweets yourself or you have used an available database of Tweet-IDs to create your collection of tweets. There is one more consideration before we are going to investigate a corpus. On Twitter a lot of content is created by a small group of users. Therefore, we have filtered out multiple tweets from the same users (as explained in the previous episode of this article). Ideally, the resulting corpus should be stored as text file with one tweet per line, including the date. In this tutorial, we will use the following format: YYYY-MM-DD ::: TWEET (Year, month and day ::: one tweet per line).

Research Questions

There are a lot of factors and features that we can investigate within a corpus. Let us address the following research questions with a more refined analysis:

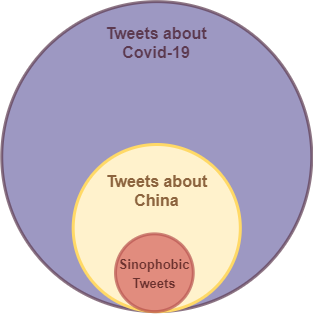
  • Research Question 01: How many Covid-19 tweets are about “China” (i.e. #China, #Chinese)?
  • Research Question 02: Among those “China”-tweets, how many feature sinophobic keywords (i.e. #Chinavirus, chink, etc)?
  • Research Question 03: Given Research Question 02, what percentage is this of the total number of tweets collected generally about the pandemic? And of the ones about the pandemic and china?
  • Research Question 04: Does this percentage change over time?
All of these research questions do not try to prove statistical significance. We are performing this analysis on a very small corpus in order to show an example of how such an analysis can be conducted with little effort and little data.

In order to create our subcorpus, which features only those tweets that are about China, we have to apply a filter:

# opening a new subcorpus file to write (w) in
with open("china_subcorpus.txt", "w") as f_out:
    with open("covid19_corpus.txt", "r") as f_in:
lines = f_in.readlines()

for line in lines:
if "china" in line.lower() or "chinese" in line.lower():
f_out.write(line)

Here, we have simply read our corpus line by line and if the line contains the word “china” or “chinese”, we write the line into a new file. Note that we have used “line.lower()” to match China = china and Chinese = chinese in case these words were spelled differently in the tweets.

Research Question 01

Now, we can calculate the proportion of tweets that include China/Chinese from the total corpus. We know that in our example, the corpus held 638,358 tweets about Covid-19 — in code, you could query “len(lines)” from the code above to inspect the length of the corpus. Therefore, we can proceed with:

chinese_corpus= len(all_tweets)
print(“Percentage of Chinese tweets from entire corpus: %.2f%%” % ((chinese_corpus/ENTIRE_CORPUS)*100))

This will evaluate to: Percentage of Chinese tweets from entire corpus: 2.63%. And consequently we can answer our research question. We can always extend this question at this point and compare this number to “German” or “English” occurrences. But let us move on to the next research question.

Research Question 02

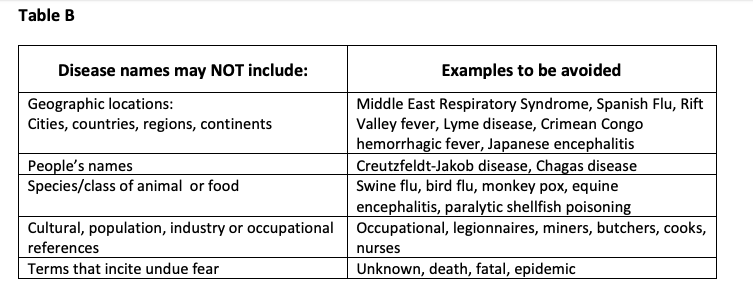
We now want to identify how many of those “Chinese”-tweets are sinophobic. We could also extend this to the entire corpus, but for now we want to proceed with a sub-corpus analysis. First of all, we need to come up with a list of sinophobic expressions. For this, we had a look at the of English derogatory terms on the Wikipedia entry “Anti-Chinese sentiment”. We’ve also included expressions from the paper “Go eat a bat, Chang!: An Early Look on the Emergence of Sinophobic Behavior on Web Communities in the Face of COVID-19" by Schild, L., Ling, C., Blackburn, J., Stringhini, G., Zhang, Y., & Zannettou, S. (2020). We can now define our list of sinophobic words as follows:

# define the keywords
sinophobic_keywords = set(["kungfuvirus", "chinesevirus", "chinavirus", "chinesewuhanvirus", "wuhanvirus", "chink", "bugland", "chankoro", "chinazi", "gook", "insectoid", "bugmen", "chingchong"])

Additionally, we could also include sinophobic compound expressions. For example, we could define a list of negative words e.g. “stupid”, “weak”, “f#cking”, “damn”, “ugly” and check if these words appear before “China” or “Chinese”.

Now, we can run this set of keywords against our sub-corpus and count the occurrences of each keyword. As we want to know which sinophobic word occurs a lot and which does not, we store all sinophobic keywords in a dictionary and initialize their count at 0:

# make a dictionary out of the keywords with the value
# being the count for its occurrence
sinophobic_occurrences = dict()
for keyword in sinophobic_keywords:
# initialize them all with counter being 0
sinophobic_occurrences[keyword.lower()] = 0

# all_tweets[timestamp]:tweet with tweets
# being the value, therefore iterate over the values()
for tweet in all_tweets.values():
# accessing the tweet (the text is stored in tweet[1])
tweet = tweet[1]
# for every sinophobic keyword in our set
for sino_word in sinophobic_keywords:
# check if the sinophobic keyword can be found in the tweet
if sino_word in tweet.lower():
# here we know which tweet has
# what kind of sinophobic word
sinophobic_occurrences[sino_word.lower()] += 1

print(sinophobic_occurrences)

This code will provide us with the result: {‘kungfuvirus’: 2, ‘bugmen’: 0, ‘chingchong’: 1, ‘chinazi’: 30, ‘bugland’: 0, ‘chinesevirus’: 1305, ‘chinavirus’: 980, ‘chankoro’: 0, ‘gook’: 0, ‘insectoid’: 0, ‘chinesewuhanvirus’: 153, ‘chink’: 4, ‘wuhanvirus’: 698}. In order to answer the research question, we need to count the individual tweets that have at least one sinophobic word, as opposed to our previous count that can include multiple sinophobic terms in a single tweet. We could adapt the code above to do that or we can just iterate over the corpus:

single_sinophobic_occurrences = 0
for tweet in all_tweets.values():
# accessing the tweet (the timestamp is stored in tweet[0])
tweet = tweet[1]
# for every sinophobic keyword in our set
for sino_word in sinophobic_keywords:
# check if the sinophobic keyword can be found in the tweet
if sino_word in tweet.lower():
single_sinophobic_occurrences += 1
break
print("Number of sino. tweets: "+str(single_sinophobic_occurrences))

This results in: Number of sino. tweets: 2531 and we can head to our third research question.

Research Question 03

We can now answer the third research question by putting all of our numbers in place and evaluate the percentages:

total_num_covid_tweets = ENTIRE_CORPUS
total_num_covid_chinese_tweets = len(all_tweets)
total_num_sinophobic_tweets = single_sinophobic_occurrences
print("Percentage of Sinophobic tweets from Chinese sub-corpus: %.2f%%" % ((total_num_sinophobic_tweets/total_num_covid_chinese_tweets)*100))
print("Percentage of Sinophobic tweets from entire corpus: %.2f%%" % ((total_num_sinophobic_tweets/total_num_covid_tweets)*100))

The result here is: Percentage of Sinophobic tweets from Chinese sub-corpus: 15.02%, Percentage of Sinophobic tweets from entire corpus: 0.39%. Note that the sinophobic tweets are only counted in the Chinese-subcorpus. There might as well be sinophobic tweets in the Covid-19 corpus that do not contain “China” or “Chinese”. This could be investigated further. Overall, it is an interesting result to observe more than 15% of all tweets that are about Covid-19 and China feature at least one sinophobic term.

Research Question 04

We can now perform a temporal analysis. Luckily, we have stored the time-stamps in our dictionary of tweets. We now need to parse this information and visualize it somehow. Here is a guideline of how we can proceed:

  1. Make a dictionary that stores all days from first to last day of the corpus, including any missing days.
  2. Go over the corpus again and look for sinophobic tweets, basically copy the code from above and paste it.
  3. This time, whenever you find a tweet containing a sinophobic tweet, increment the value for the respective day.
  4. Now, you’ll have a dictionary for every day with the number of counted sinophobic tweets on that day.
  5. Then divide each of those counted values by the total number of tweets of that day to receive the proportional value.
# import libraries to handle dates
from datetime import datetime, date, timedelta
# create dictionaries to store tweets
days_dict_sino = dict()
days_dict_all = dict()
# access the date entry (index 0) of the first tweet (index 0)
start_date_string = list(all_tweets.values())[0][0].split(" ")[0]
# access the date entry (index 0) of the last tweet (index -1)
end_date_string = list(all_tweets.values())[-1][0].split(" ")[0]
# format the date
start_date = datetime.strptime(start_date_string, '%Y-%m-%d')
end_date = datetime.strptime(end_date_string, '%Y-%m-%d')
delta = end_date - start_date
days = [start_date + timedelta(days=i) for i in range(delta.days + 1)]
# Create daily dictionaries
for day in days:
day = day.strftime("%Y-%m-%d")
days_dict_sino[day] = 0
days_dict_all[day] = 0
# Fill daily dictionaries with counts of sinophobic tweets
for dat, tweet in all_tweets.values():
day = dat.split(" ")[0]
for sino_word in sinophobic_keywords:
if sino_word in tweet.lower():
days_dict_sino[day]+=1
days_dict_all[day]+=1

After we have done that, we should have a list with absolute occurrences of sinophobic tweets in our China-Covid19-Corpus per day. Next we need to turn those numbers to proportional values:

all_daily_tweets = list(days_dict_all.values())
all_daily_sino_tweets = list(days_dict_sino.values())
perc_results = []
for tot_tweets, sino_tweets in zip(all_daily_tweets, all_daily_sino_tweets):
if tot_tweets == 0:
perc_results.append(0)
else:
perc_results.append((sino_tweets/tot_tweets)*100)

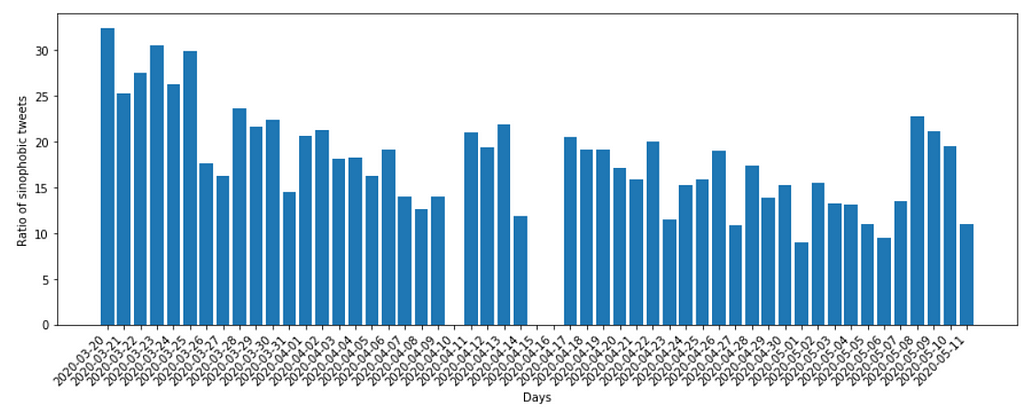
We can now simply use a plot function to visualize the trend over time. There are many ways of visualizing this kind of data, but we will look at a very basic bar graph using matplotlib:

import matplotlib.pyplot as plt
plt.figure(figsize=[15,5])       
plt.xlabel("Days")
plt.ylabel("Ratio of sinophobic tweets")
plt.bar(range(0,len(perc_results)), perc_results)
plt.xticks(range(0,len(perc_results)), days_dict_all.keys(), ha='right', rotation=45)
plt.show()

As a result we can observe the ratio of sinophobic tweets is relatively stable, except for a the last few days. Interpreting this graph and the data is the task of the next Conceptual article. Notably, we have included three days with missing data in the graph. Whenever you are collecting data on Twitter over the course of a few weeks, you can expect that there can be issues with the Twitter API. All other linked datasets also show missing data on other days.

We can now say that we have provided the empirical evaluation to discuss our research questions and the conceptual underpinnings. Our goal in this post was not to provide a strict, statistical analysis or hard empirical evidence — those can be found in numerous scientific articles (here, here, here and here).

In the next article, we can finally start to apply some Machine Learning. We will use topic modeling in order to see what other topics emerge in our corpus, i.e. what do people talk about when they talk about China and Covid-19. The next technical article will be accompanied by a conceptual article which will better explain the findings overall.

The Rise of Sinophobia on Twitter during the Covid-19 Pandemic — Technical Part 2 was originally published in AI for People on Medium, where people are continuing the conversation by highlighting and responding to this story.

The Rise of Sinophobia on Twitter during the Covid-19 Pandemic — Conceptual Part 1

The Rise of Sinophobia on Twitter during the Covid-19 Pandemic — Conceptual Part 1

Written by Philipp Wicke and Marta Ziosi for AI For People — 23.05.2020

In this article, we will have a look at the conceptual underpinnings of the first episode of our series on “Analyzing online discourse for everyone”. In this first part, we will concern ourselves with the socio-historical background which set the stage for the rise of Sinophobia during the Covid-19 pandemic. This article better prepares the reader for our more specific analysis, which follows in our next episode.

Follow the link: https://medium.com/ai-for-people/the-rise-of-sinophobia-on-twitter-during-the-covid-19-pandemic-technical-pa
Follow the link: https://medium.com/ai-for-people/the-rise-of-sinophobia-on-twitter-during-the-covid-19-pandemic-technical-part-1-abebd2bd57d4

Why China and the Virus?

During the Covid-19 pandemic, “Chinese Virus” or “Wuhan Virus” emerged as controversial terms for the virus. While the expressions may appear neutral to some, simply relating to the physical origin of the virus, to others the terms are instead linking ethnicity to it. Regardless of how we settle the debate, we argue that language plays an important role in this context. As Boroditsky suggests, the way we talk shapes the way we think. Equally, the way we talk about a virus shapes the way we understand it and relate to it as a concept. That is why we decided to take a deeper look at how people talk on social media about the virus, in relation to China. Given a worrying rise in Sinophobia during the outbreak, we decided to answer the following question through our research, ‘‘To what extent does Sinophobia feature in Covid-19 tweets?’. Before presenting our more specific findings in our next episode, we hereby place Sinophobia in a broader socio-political context.

What is Sinophobic and what is not?

In the 1980s, HIV became associated with Haitian Americans, in 2003 SARS was associated with Chinese Americans and in 2009, H1N1, or swine flu, was associated with Mexican Americans. Either because spreading among a certain community or because originating from a certain territory, infectious diseases are often inadequately associated with a population or a country.

Published in 2015, WHO guidelines for the “Naming of New Human Infectious Diseases” discourage the use of ‘geographical location’ and ‘cultural or population references’ in naming diseases.
WHO Best Practices for the Naming of New Human Infectious Diseases, May 2015, © World Health Organization 2015. All rights reserved.

Among those, they cite ‘Middle East Respiratory Syndrome, Spanish Flu, Rift Valley fever, Lyme disease, Crimean Congo hemorrhagic fever and Japanese encephalitis’ as examples of names to be avoided. Pairing an illness with a country or an ethnicity leads to a personification of the virus. On one hand, this is tempting as it allows us to more clearly identify what would otherwise be an abstract threat. On the other, it runs the risk of equating an illness — a disorder which affects a population — with the population itself. This might wrongly suggest that a population ‘carries’ the disease by means of its ethnicity or even that it played a role in generating the illness. The latter does not come as news, given the conspiracy theory about Covid-19 being created in a lab in Wuhan by Chinese researchers.

An exerpt from Trump’s speech, with his own edits. Credits of the picture go to: https://twitter.com/jabinbotsford/status/1240701140141879298

Notwithstanding the above considerations, the terms “Chinese Virus” and “Wuhan Virus” appeared in several media reports, especially in the early days of the outbreak. As a matter of fact, many people — among which highly ranked politicians — do not consider the term to be discriminatory. For example, the President of the United States, justified his calling Covid-19 the “Chinese Virus” as:

“It’s not racist at all. No, it’s not at all. It’s from China. That’s why. It comes from China. I want to be accurate.” (March 18)

Indeed, it could be argued that the name simply suggests the location where the virus originated. However, as a matter of fact, racist acts and harassment against Asians which were already on the rise, registered a peak in the third week of March, when over 650 racist acts where reported by Asian Americans just in the US.

The above suggests that, even if not intrinsically racist, terms such as ‘Chinese Virus’ or ‘Wuhan Virus’ are consequentially so, as they negatively impact the lives of many Asians all over the world.

A bit of history

It is important to consider that racist acts against Asians are not solely traceable back to Covid-19. History reveals that in the case of Asian Americans — which are also the ones mostly targeted by the present discourse— there exist several precedents. Let us start from far back in time, with the Chinese Exclusion Act of 1882 in the US. Building on the 1875 Page Act, which banned Chinese women from immigrating to the United States, the Chinese Exclusion Act barred Chinese laborers from immigrating to the United States. At the time, Chinese composed only .002 % of the US population. Nevertheless, many Americans — especially on the West Coast — attributed declining wages and economic ills to Chinese workers. This condition was only relaxed in 1943, when 105 Chinese were allowed to enter per year.

Columbia in an 1871 Thomas Nast cartoon, protecting a Chinese man. The billboard behind is full of inflammatory anti-Chinese broadsheets. By Thomas Nast — https://web.archive.org/web/20160305185106/http://thomasnastcartoons.com/2016/02/13/the-chinese-question/, Public Domain, https://commons.wikimedia.org/w/index.php?curid=47341561

Nearby, in Canada, the Royal Commission on Chinese Immigration was appointed in 1885 to obtain proof that restricting Chinese immigration was in the best interest of the country. The Commission wrote a report which described Chinese as immoral, dishonest, unclean, prone to disease and incapable of assimilation. These judgments were largely based on common stereotypes rather than any research.

Anti-Chinese sentiment rose again in the US during the Cold War, due to McCarthyism. During that era, suspected Communists were imprisoned by the hundreds, and some ten or twelve thousand of them lost their jobs.

From 1965 until today, the modern immigration wave from Asia to the US has accounted for one-quarter of all immigrants who have arrived in the country. In the US, the population of Asian Americans counts approximately 22,408,464 people, with Chinese being the largest group.

How does history relate to the present?

The past history of racism and the significant presence of people from Asian origin — especially Chinese- in the US population does not simply serve as a precedent, but also as an admonition for the present. If not carefully addressed, Sinophobic trends rising during the pandemic could have serious, impactful consequences. These considerations lead us to search for those Sinophobic trends, which find their origins in history, in the present context of Covid-19. We decided to focus our research on Twitter, one of the main ‘places’ where modern discourse takes place nowadays.

The points raised above lead us to consider as Sinophobic hashtags such as ‘#ChineseVirus’, ‘#Chinavirus’ and ‘#Wuhanvirus’. Nevertheless, our research revealed that these are not the only Sinophobic terms currently in use.

Digging deeper

In further conducting our research, we discovered that the above terms were not the only terms in use which were affecting Asian communities. A study by Schild et al. (2020) found that real-world events related to the outbreak of the Covid-19 pandemic coincided with an increase in the use of Sinophobic slurs such as “chink,” “bugland,” “chankoro,” “chinazi,” “gook,” “insectoid,” “bugmen,” and “chingchong” in online discourse on Twitter and 4Chan.

Admittedly, given the increasing dominance of China in the newly emerging World-order, its name is often evoked in multiple current contexts. Examples of these are the trade-war between the US and China, the South-China Sea dispute, the Uyghur ethnic minority and the ongoing tensions with Hong Kong.

These disputes have given birth to their own discourses, often accompanied by negative terms towards the Chinese Government.

We thus considered that some of the above Sinophobic slurs might not be strictly related to the virus. For example, given the pressure of China over Hong Kong, terms such as ‘chinazi’ are often used in the context of the HK protests to express negative sentiments towards the Mainland.

Picture from the Umbrella Movement in Hong Kong. By Pasu Au Yeung / CC BY (https://creativecommons.org/licenses/by/2.0)

The same study by Schild et al. (2020), however, discovered also new emerging slurs and terms more directly related to Sinophobic behavior, as well as the Covid-19 pandemic. Examples of these terms were “kungflu” and “asshoe”. While the first one associates the virus (wrongly stated as ‘flu’) with traditional Chinese Martial Arts, the second aims to make fun of the accent of Chinese people speaking English.

Where to next?

The socio-historical excursus which this article represents displays the complexity of the case at hand. People’s perception of what is Sinophobic changes, though the consequences stay. Furthermore, Sinophobic terms often generate from multiple contexts and while sometimes they are directed towards the people, sometimes they are aimed at the actions of the Chinese government. In our next article, we will present you with our own findings in the search for Sinophobic words in the context of Covid-19. We will consider as Sinophobic words that are blatantly so, like “chink” or “bugland”, as well as more debated terms such as ‘’Chinesevirus” or “Chinavirus”. We hope that this first article set the stage for you to better grasp what follows.


The Rise of Sinophobia on Twitter during the Covid-19 Pandemic — Conceptual Part 1 was originally published in AI for People on Medium, where people are continuing the conversation by highlighting and responding to this story.

The Rise of Sinophobia on Twitter during the Covid-19 Pandemic —  Technical Part 1

The Rise of Sinophobia on Twitter during the Covid-19 Pandemic — Technical Part 1

Written by Philipp Wicke and Marta Ziosi for AI For People — 23.05.2020

Follow the link: https://medium.com/ai-for-people/the-rise-of-sinophobia-on-twitter-during-the-covid-19-pandemic-conceptual-p
Follow the link: https://medium.com/ai-for-people/the-rise-of-sinophobia-on-twitter-during-the-covid-19-pandemic-conceptual-part-1-545f81a61619

In this article, we will have a look at the technical underpinnings of the first episode of our series on “Analyzing online discourse for everyone”. In this first part, we will concern ourselves with the data acquisition process. We will outline how to approach a data mining task and how to implement it.

In order to obtain data about an online discourse, we first need to answer a few questions:

  • What is considered online discourse?
  • How can we access online discourse?
  • How much online discourse do we need to observe?
[1] Data Mining. How to obtain information from the internet?

We can consider online discourse to be everything discussed in an online environment. As much as newspapers, government websites and academic articles are concerned, we want to focus on a broader section of the online discourse, one that has almost no filters: Twitter.

Twitter is ideal, because there are about 330 million monthly active users (as of Q1 in 2019). Of these, more than 40 percent use the service on a daily basis creating about 500 million tweets per day. Furthermore, those tweets are mostly freely accessible! In fact, this provides so much data that we need to create our own filters. Our first step is therefore to see what we can access and what we actually need to access:

We want:

  • Data over a period of time
  • Data relating to a certain topic
  • Data of a considerable proportion

We get:

  • The free Twitter API allows access to the last 7–10 days of tweets
  • Everyday has about 500.000.000 tweets
  • With collection restriction (rate limits), we can collect about 10.000/hour.

Now, we need to put together what-we-want and what-we-get. In this tutorial we will write python code that has three simple requirements: Python 3.7+, the Tweepy Package and a Twitter account.

The Tweepy API connects Python with Twitter.

There are a lot of great tutorials that explain the use of Tweepy, how to create Twitterbots and probably also how to obtain data from Twitter and using it. Therefore, we will keep it short here and do not explain what the tool is that we use, but we will explain how we use this tool in detail.

We go to the Twitter Developer page and login with out Twitter credentials (you might need to apply for a developer account, which is fairly easy and briefly done). Next, we will have to create an App and generate our access credentials. Those credentials will be the key to connect the Tweepy API with the Python program. Make sure to store a copy of the access tokens:

Generating Twitter API key and Access Tokens for Tweepy on the twitter-dev website.

Now, we have everything to start writing our Python code. First of all, we need to import the Tweepy package (install with “pip install tweepy”) and we will have to write our access credentials and tokens into the code:

import tweepy as tw
consumer_key= "writeYourOwnConsumerKeyHere12345"
consumer_secret= "writeYourOwnConsumerSecretHere12345"
access_token= "writeYourOwnAccessTokenHere12345"
access_token_secret= "infowriteYourOwnAccessTokenSecretHere12345"

With the right keys and tokens, we can now authenticate our access to Twitter through our Python code:

# Twitter authentication
auth = tw.OAuthHandler(consumer_key, consumer_secret)
auth.set_access_token(access_token, access_token_secret)
api = tw.API(auth, wait_on_rate_limit=True, wait_on_rate_limit_notify=True)

What is happening in this code above? Well, we use tweepy to create an Authentication Handler and store it in “auth” using the consumer key and consumer secret — basically we define through which door we want to access Twitter and with the “auth.set_access_token(…)” we provide the key to access the door. Now, the open door will be stored with certain parameters in “api”. One of those parameters is the door (“auth”) and the other one here is called “wait_on_rate_limit=True”. We can see in the Tweepy API that this parameter decides “Whether or not to automatically wait for rate limits to replenish”. Why?

The free Twitter access comes with a rate limit, i.e. you can only download a certain number of tweets before you need to wait or before Twitter kicks you out. But: “Rate limits are divided into 15 minute intervals.” When we set wait_on_rate_limit to True, we will have our program wait automatically 15 minutes so that Twitter does not lock us out, whenever we exceed the rate limit and we automatically continue to get new data!

Now, we need to specify the parameters for our search:

start_day: Date of beginning to crawl data in format YYYY-MM-DD. It can only be 7 days in the past.

end_day: Date of ending to crawl data in format YYYY-MM-DD. If you want to crawl for a single day, set this to the day after the start_day.

amount: Specify how many tweets you want to collect. Maybe take 15 for the beginning to test everything.

label: In order to store the data, you need to label it, otherwise you'll override it every time!

search_words: This is a string that combines your search words with AND or OR connection. We will look at an example of this.

start_day = "2020–05–23"
end_day = "2020–05–24"
amount = 50
# stores the data here as: test_2020–04–06_15
label = "test_"+start_day+"_n"+str(amount)
search_words = "#covid19 OR #coronavirus OR #ncov2019 OR #2019ncov OR #nCoV OR #nCoV2019 OR #2019nCoV OR #COVID19 -filter:retweets"

The parameters above will collect a test sample of 50 (amount) tweets from the 23rd of May to 24th of May — so just 50 tweets from one day. And those tweets will be stored in the file “test_2020–05–23_n50”. We now apply the first filter, otherwise we would just collect any sort of tweet from that day. Our search words are common hashtags of the Covid19 discourse: #covid19 #coronavirus etc. Furthermore, we want to look at tweets and not re-tweets, therefore we exclude re-tweets with “-filter:retweets”. Now, we can start to obtain the data and run:

tweets = tw.Cursor(api.search,
tweet_mode='extended',
q=search_words,
lang="en",
since=start_day,
until=end_day).items(amount)

Here, we further set the language to “en” = English and the tweet mode to “extended”, which makes sure the entire tweet is stored. The rest of the parameters are as we have defined them before. Now, in the next two lines of code, we simply reformat the obtained tweets into a list and print the first tweet just to have a look:

tweets = [tweet for tweet in tweets]
print(tweets[0])
Status(_api=<tweepy.api.API object at 0x0FFF37D0>, _json={‘created_at’: ‘Mon Apr 06 23:59:59 +0000 2020’, ‘id’: 124367356449479936, ‘id_str’: ‘124367356449479936’, ‘full_text’: ‘we will get through this together #Covid19’, ‘truncated’: False, ‘display_text_range’: [0, 42], ‘entities’: {‘hashtags’: [{‘text’: ‘Covid19’, ‘indices’: [34, 42]}], ‘symbols’: [], ‘user_mentions’: [], ‘urls’: []}, ‘metadata’: {‘iso_language_code’: ‘en’, ‘result_type’: ‘recent’}, ‘source’: ‘<a href=”https://mobile.twitter.com" rel=”nofollow”>Twitter Web App</a>’, ‘in_reply_to_status_id’: None, ‘in_reply_to_status_id_str’: None, ‘in_reply_to_user_id’: None, ‘in_reply_to_user_id_str’: None, ‘in_reply_to_screen_name’: None, ‘user’: {‘id’: 45367I723, ‘id_str’: ‘45367I723’, ‘name’: ‘John Doe’, ‘screen_name’: ‘jodoe’, ‘location’: ‘’, ‘description’: ‘’, ‘url’: None, ‘entities’: {‘description’: {‘urls’: []}}, ‘protected’: False, ‘followers_count’: 188, ‘friends_count’: 611 …

As you can see, this is a ton of information. Number of retweets, number of likes, coordinates, profile background image url… everything about that single tweet! That is why we now filter for the user.id and the full_text. If you want you can also access other information such as location etc, but for now we are not interested in that. Have a look at the following code, before you can find its explanation below:

first_entry = None
last_entry = None
all_user_ids = []
raw_tweets = []
for tweet in tweets:

if not first_entry:
first_entry = tweet.created_at.strftime(“%Y-%m-%d %H:%M:%S”)
print("First tweet collected at: "+str(first_entry))
print(" — — — — — — — — — — — — — — — — — — — — — -")

if tweet.user.id not in all_user_ids:
all_user_ids.append(tweet.user.id)
full_tweet = tweet.full_text.replace('\n','')
if full_tweet:
print("User #"+str(tweet.user.id)+" : ")
print(full_tweet+"\n — — — — — — ")
raw_tweets.append(full_tweet)

last_entry = tweet.created_at.strftime("%Y-%m-%d %H:%M:%S")
print("Last tweet collected at: "+str(last_entry))

This code creates an empty list for all the user ids and then iterates over all tweets. It looks at the created_at field of a tweet to check whether it is the first entry (because we initially set first_entry to None). Now it checks if tweet.user.id is not in the list of all_user_ids. This means it only looks at tweets from users we have not seen yet. Why did we do that?

A scientific analysis of fake news spread during the 2016 US presidential election showed that about 1% of users accounted for 80% of fake news and report that other research suggests that 80% of all tweets can be linked to the top 10% of most tweeting users. Therefore, in order to have a representation of a diverse opinion that cannot be linked to a few but many users, we filter out multiple tweets from the same user.

Then our code appends the user id (as we now have seen the user) and stores the full tweet. The replace statement (replace(“\n”, “ “)) just gets rid of line-breaks in tweets. The if full_tweet is checked, because we could have an empty tweet (which sometimes is a bug of the api). We print the full tweet (the “\n — — — — — “ is a line break and some dashes so it looks nicer when printed). And store each full tweet in a list called raw_tweets. Finally, we access the created_at field to get the date of creation when we have reached the very last tweet. Our script will then print some of the collected tweets, which could look like this:

First tweet collected at: 2020-04-06 23:59:59
-------------------------------------------
User #20I3120348:
we will get through this together #Covid19
------------
User #203480I312:
They fear #Trump2020. They created this version of #coronavirus Just to get him out of office. Looks like the plan worked in the UK...
------------
User #96902235II37193185:
Like millions of others I don't see eye to eye with Boris Johnson but I hope he pulls through. Why? Because I'm human. I wouldn't wish this on my worst enemy. I've witnessed someone die of pneumonia and believe me it's NOT pretty. #GetWellBoris #PrayForBoris #COVID19

And that is it for the first part! We have now collected 50 tweets from the 23rd of May 2020 that relate to the Covid19 discourse. Hopefully, it is clear how this script can be extended to create an entire corpus of thousands of tweets over multiple days. Such corpus has thankfully be created by various researchers, including ourselves. With this corpus we can then start to investigate the relation between the Covid19 discourse and Sinophobia.

In the next article of this series, we’ll look at some Natural Language Processing, Data Analysis and Topic Modeling to assess the data we have collected!

References

[1] Bucket-wheel excavator 286, Inden surface mine, Germany; the bucket-wheel is under repair. 10. April 2016. https://pixabay.com/en/open-pit-mining-raw-materials-1327116/ pixel2013 (Silvia & Frank) Edit: Cropped and overlay of numbers. CC0 1.0.


The Rise of Sinophobia on Twitter during the Covid-19 Pandemic —  Technical Part 1 was originally published in AI for People on Medium, where people are continuing the conversation by highlighting and responding to this story.